Honest Charts, Honest Stories
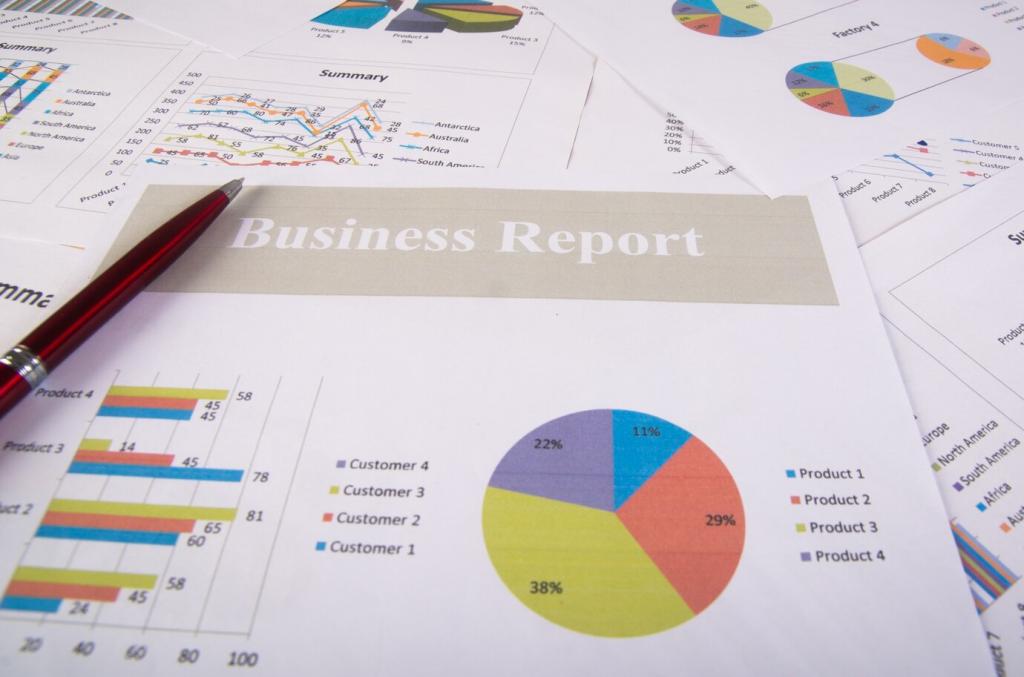
Start axes at honest baselines, label units, and show full time horizons where possible. Small design choices can exaggerate trends, hiding nuance readers need to judge responsibly.
Honest Charts, Honest Stories
Flag confidence intervals, data revisions, and seasonal quirks. A chart that admits uncertainty respects readers, teaching them to interpret economic signals as probabilities rather than certainties.


